[project]Build a dashboard with flexdashboard
A dashboard project used to monitor data collection in a survey
Introduction
A dashboard is a management tool allowing, thanks to its content, to follow the evolution of a process. It measures performance in order to judge the state of progress (the path traveled) and the path remaining to be traveled to reach the objectives set.
In industry, for example, it helps to monitor indicators associated with the production process. In the area of surveys, a dashboard can be used during data collection to track collection through a number of selected indicators. It therefore constitutes a powerful decision-support tool, allowing to detect variations in real time (if possible).
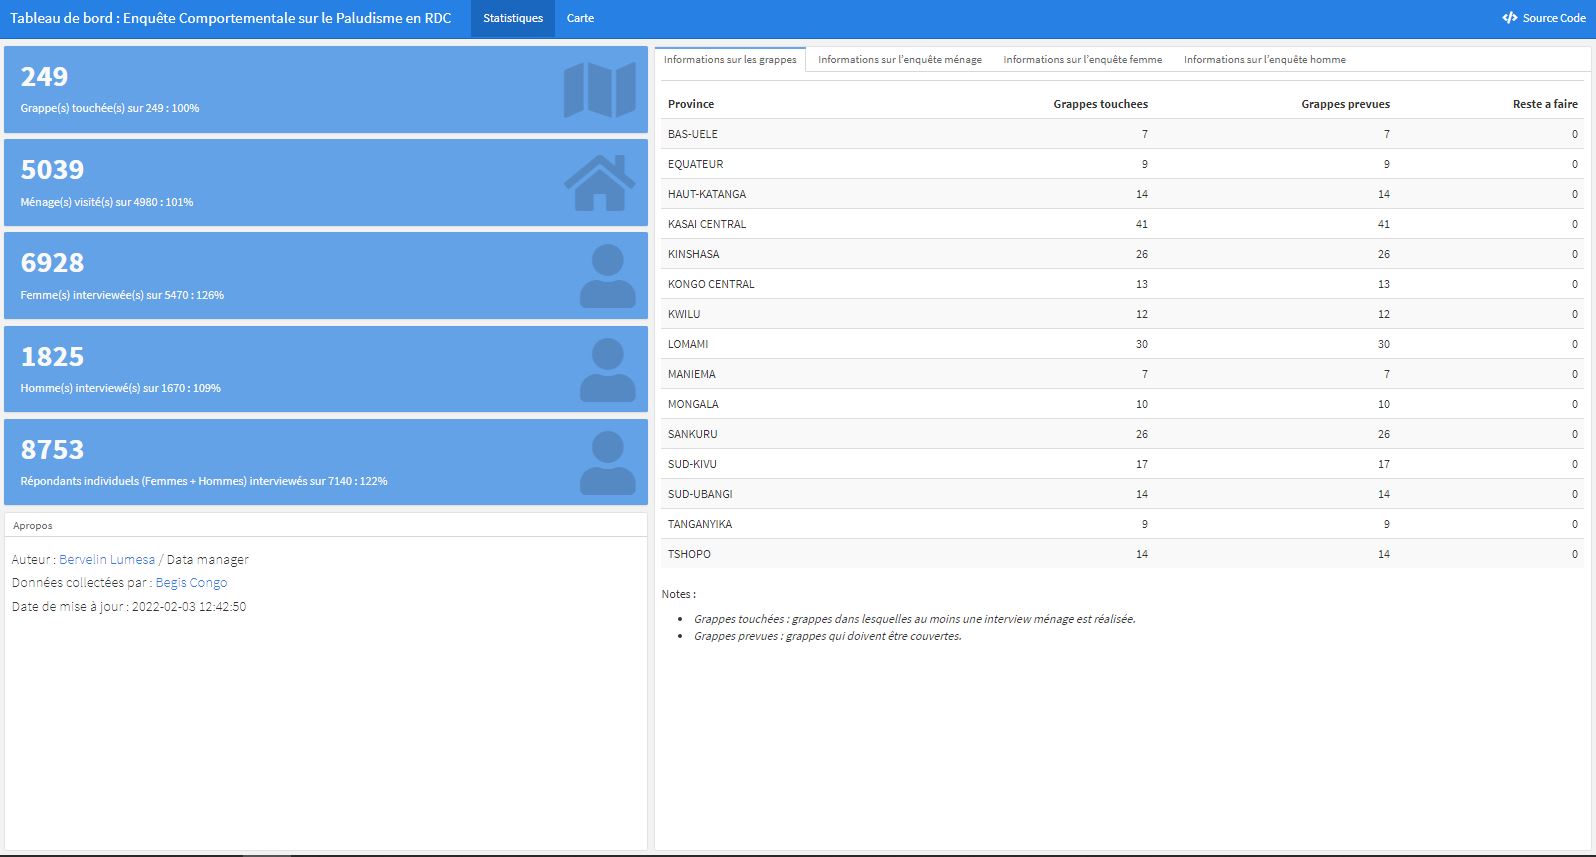
I share with you the R codes of the dashboard I designed and used during the data collection operation as part of the Malaria Behavioral Survey in the DRC in 2021 with Begis Congo.
Dashboard construction
This dashboard was created with the R language and its IDE Rstudio, with the flexdashbord package which is specialized for creating dashboards. Some other packages were used : haven and foreign for data import, leaflet for the map, tidyverse for data manipulation, kableExtra and knitr for beautiful tables.
This dashboard is mainly composed of two parts: the first one shows some indicators such as the number of households visited, the number of women and men surveyed and many others. The second gives a spatial distribution of the households surveyed on an interactive map, with different colors for each household status.
For more reading, check the following links :
- flexdashboard
- Example projects
- Geospatial Health Data: Modeling and Visualization with R-INLA and Shiny
All the code of this project and others can be downloaded in Github.
Was this post helpful ? Don’t forget to share it !
TO KUTANI MBALA YA SIMA :)